Hi, I’m Adam! I’m a designer and programmer, with a specialization in data visualization.
A substantial aspect of my work and process is creating diagrams and pictures to help people process, understand and think through a particular problem. Tangibly this means building wireframes, doing UI/UX, creating scrappy prototypes, and drawing diagrams live with clients.
If my work stands out to you or if you just want to connect, that’s your invitation to email send me an email or calendar_today book a call with me.
You can also description read my CV as a PDF if you prefer.
Past Work
Issue Identification Tool for Wind/Solar (TrendLine, 2024-2026)
An internal tool that helps identify the worst actors across the wind/solar fleet.
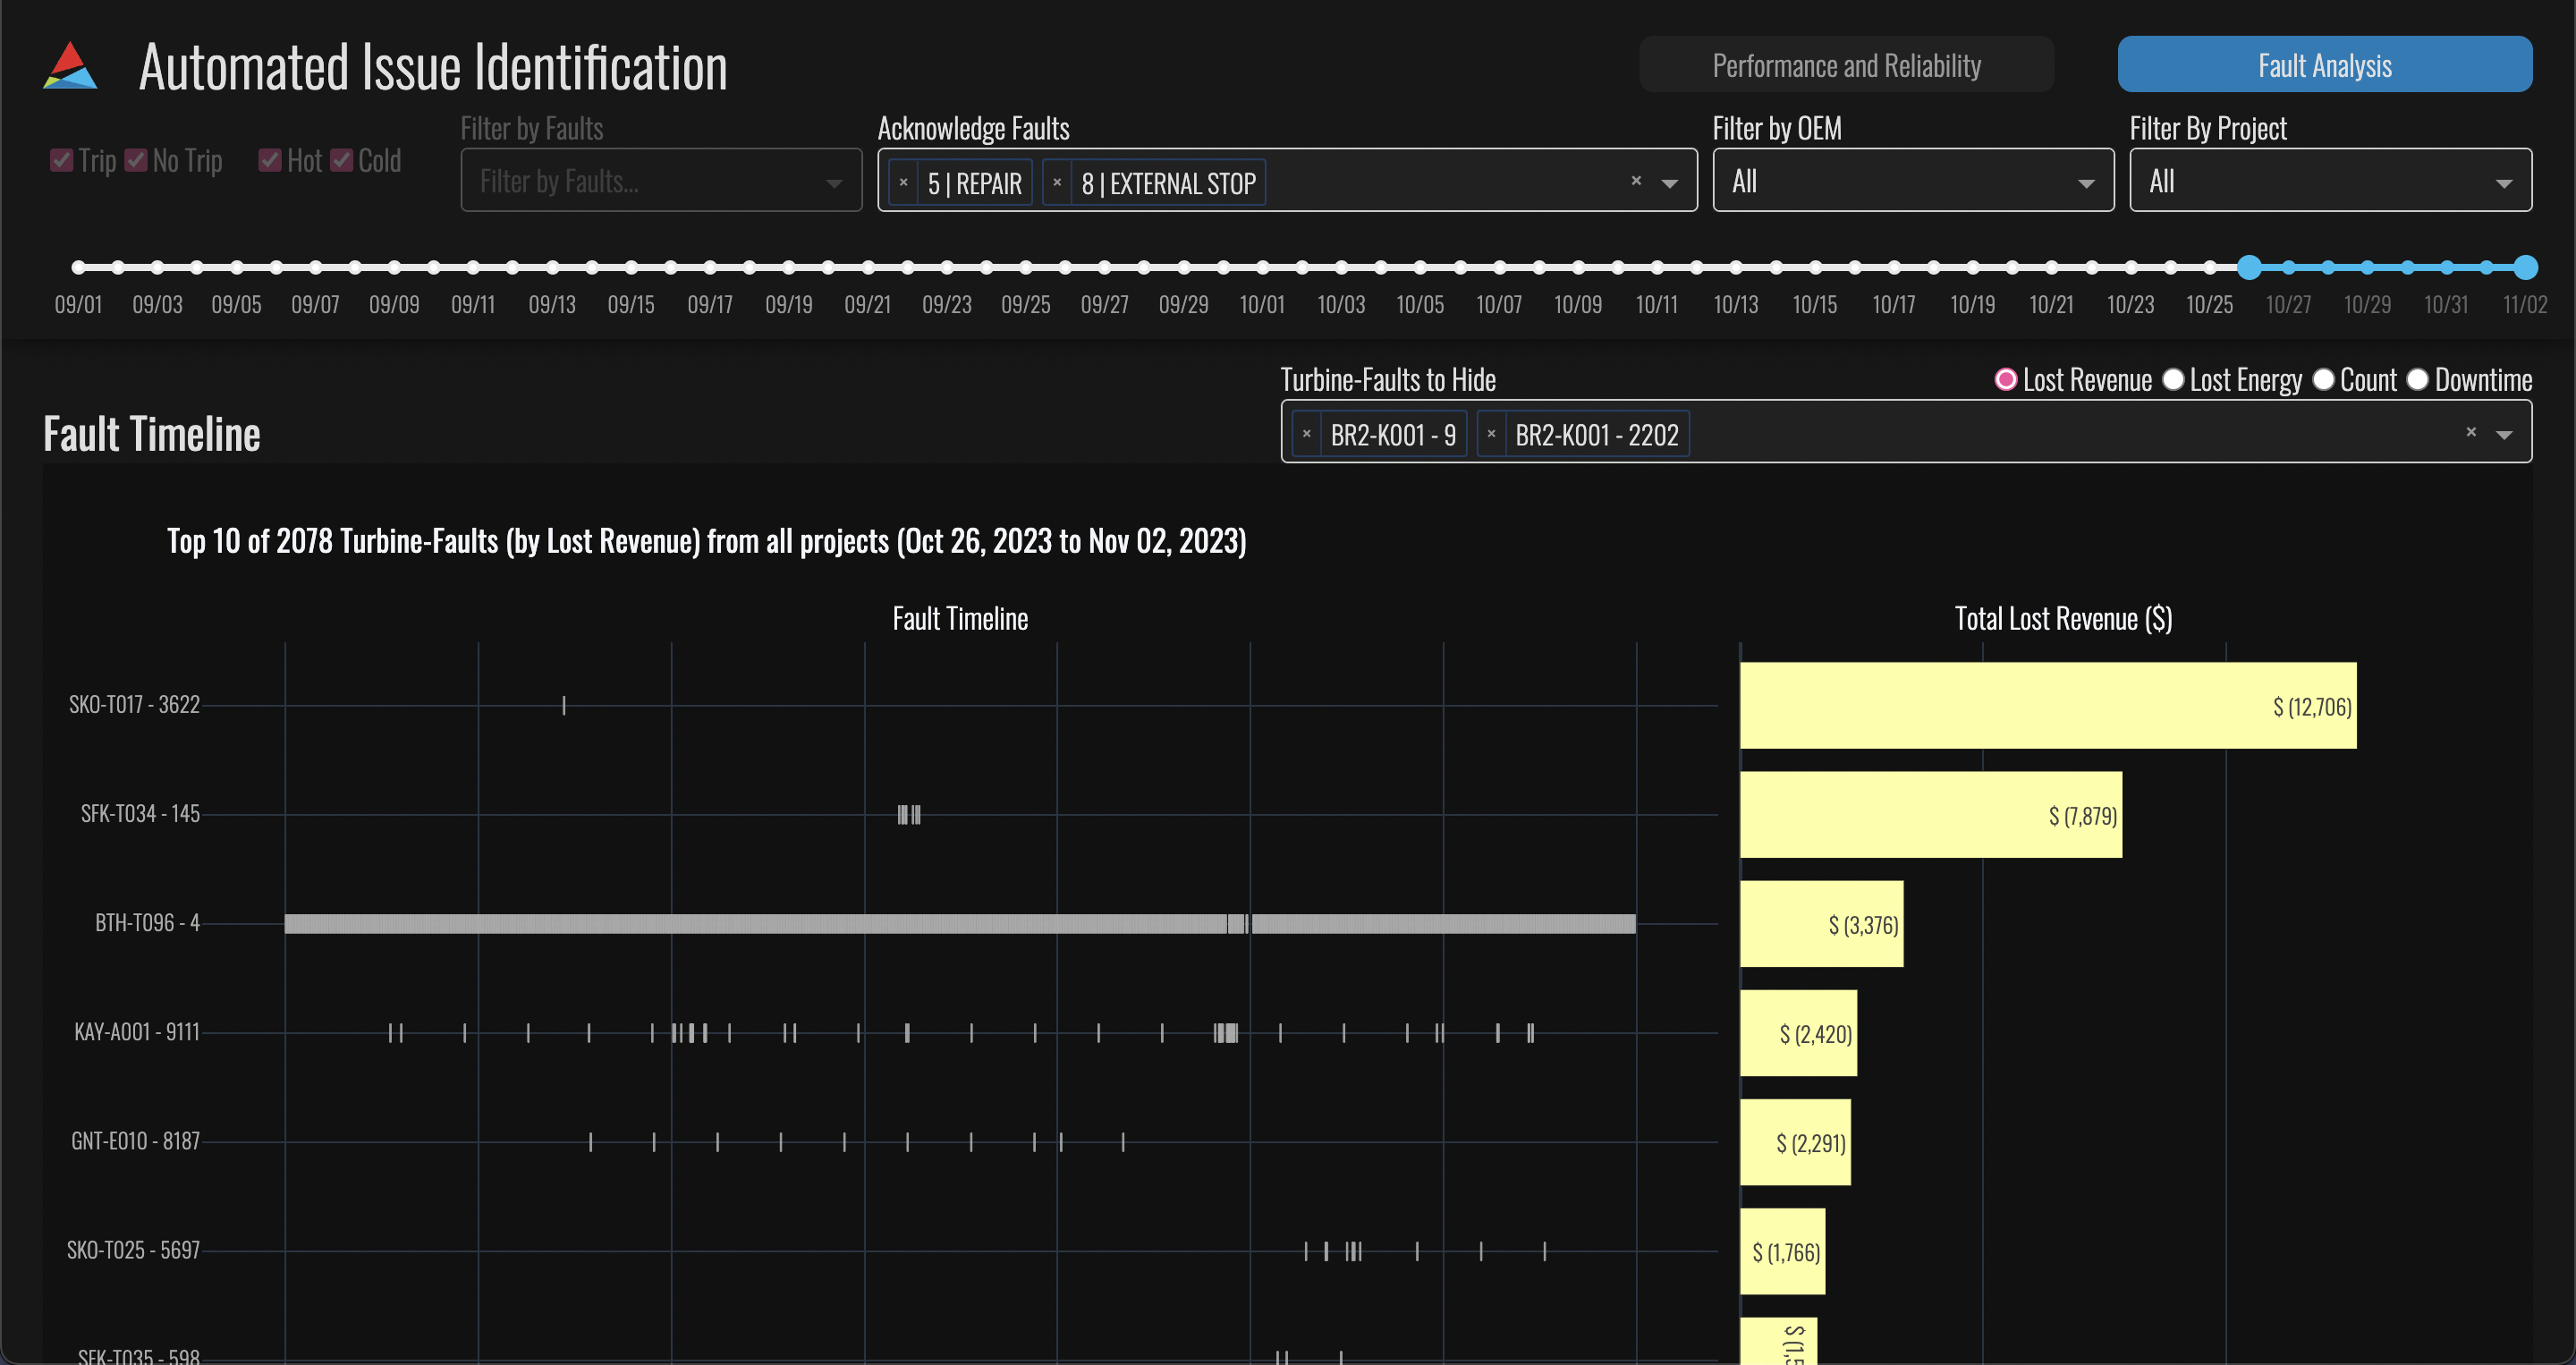
- Developed an internal diagnostic tool to help identify issues with wind and solar assets, indicating where and why revenue was lost. The tool is now actively used by site engineers and data analysts to monitor the performance of inverters, combiners, weather stations, and turbines.
- The tool has enabled the equipment monitoring team to detect issues worth around $100,000 per year since its usage. Additionally, users have reported upwards of 35 performance issues which have led to tickets dispatched for further diagnosing and further investigations.
- Lead UI designer, front-end programmer, and project manager for this project.
Differential Analysis Tool (General Metabolics, 2021)
An internal tool for researchers and academics to run metabolomic scenarios.
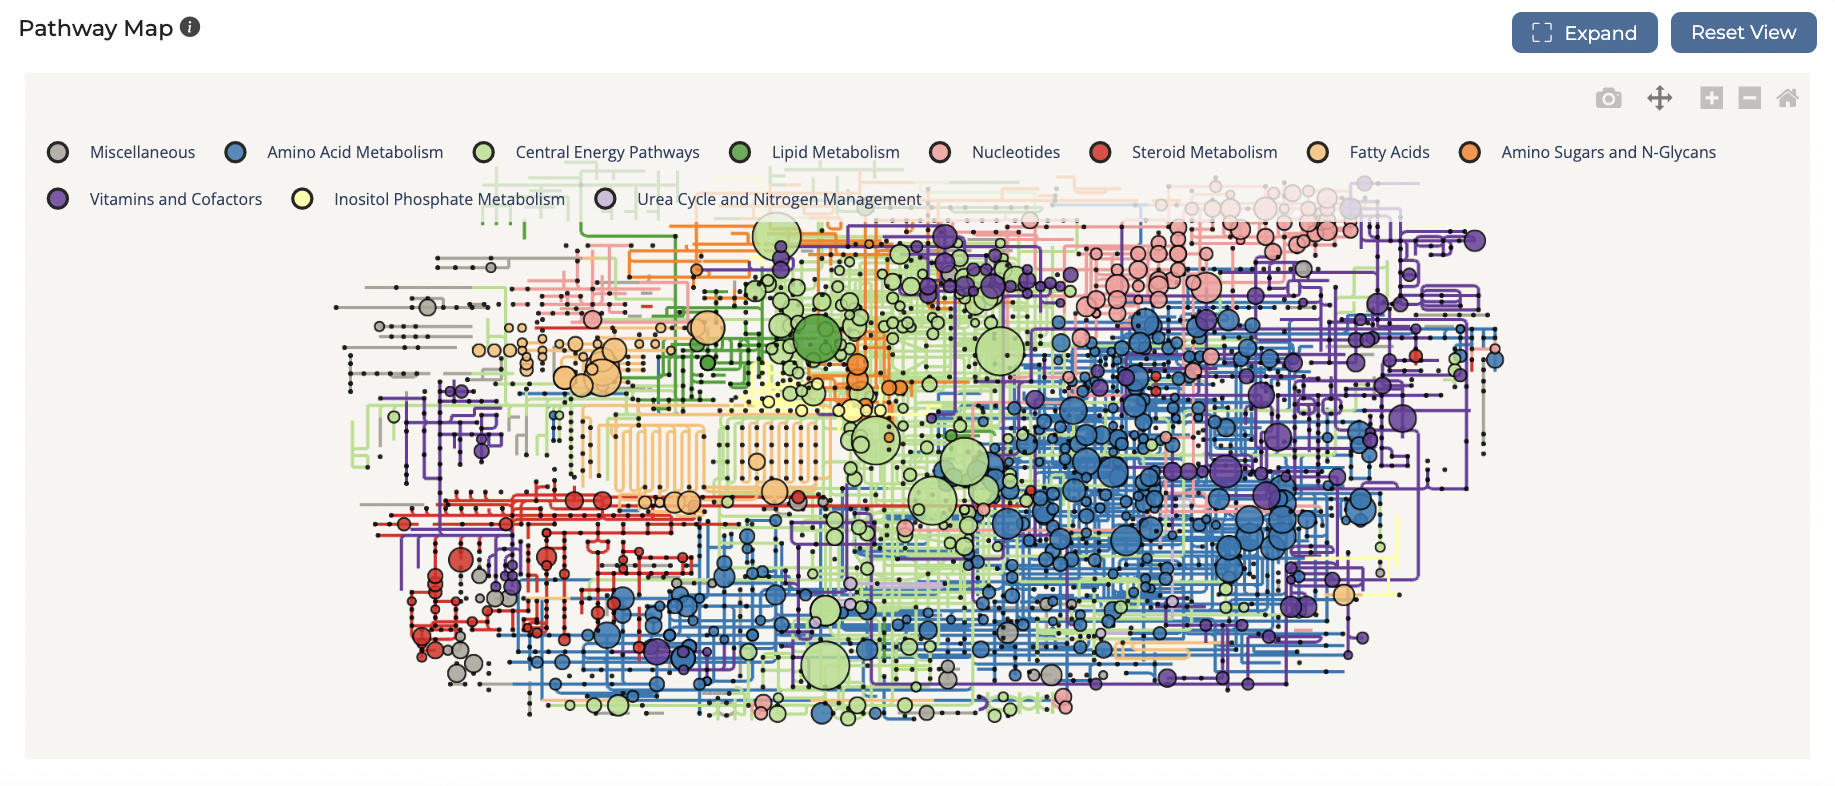
- Designed and developed a BioTech tool to help scientists and researchers run analyses on their metabolomic data.
- The tool is actively maintained to date, and is used by researchers at leading academic and BioPharma research institutions, including multinational Pharma companies.
Solar App (TrendLine, 2022)
An internal MVP to help detect anomalies with solar assets and equipment.
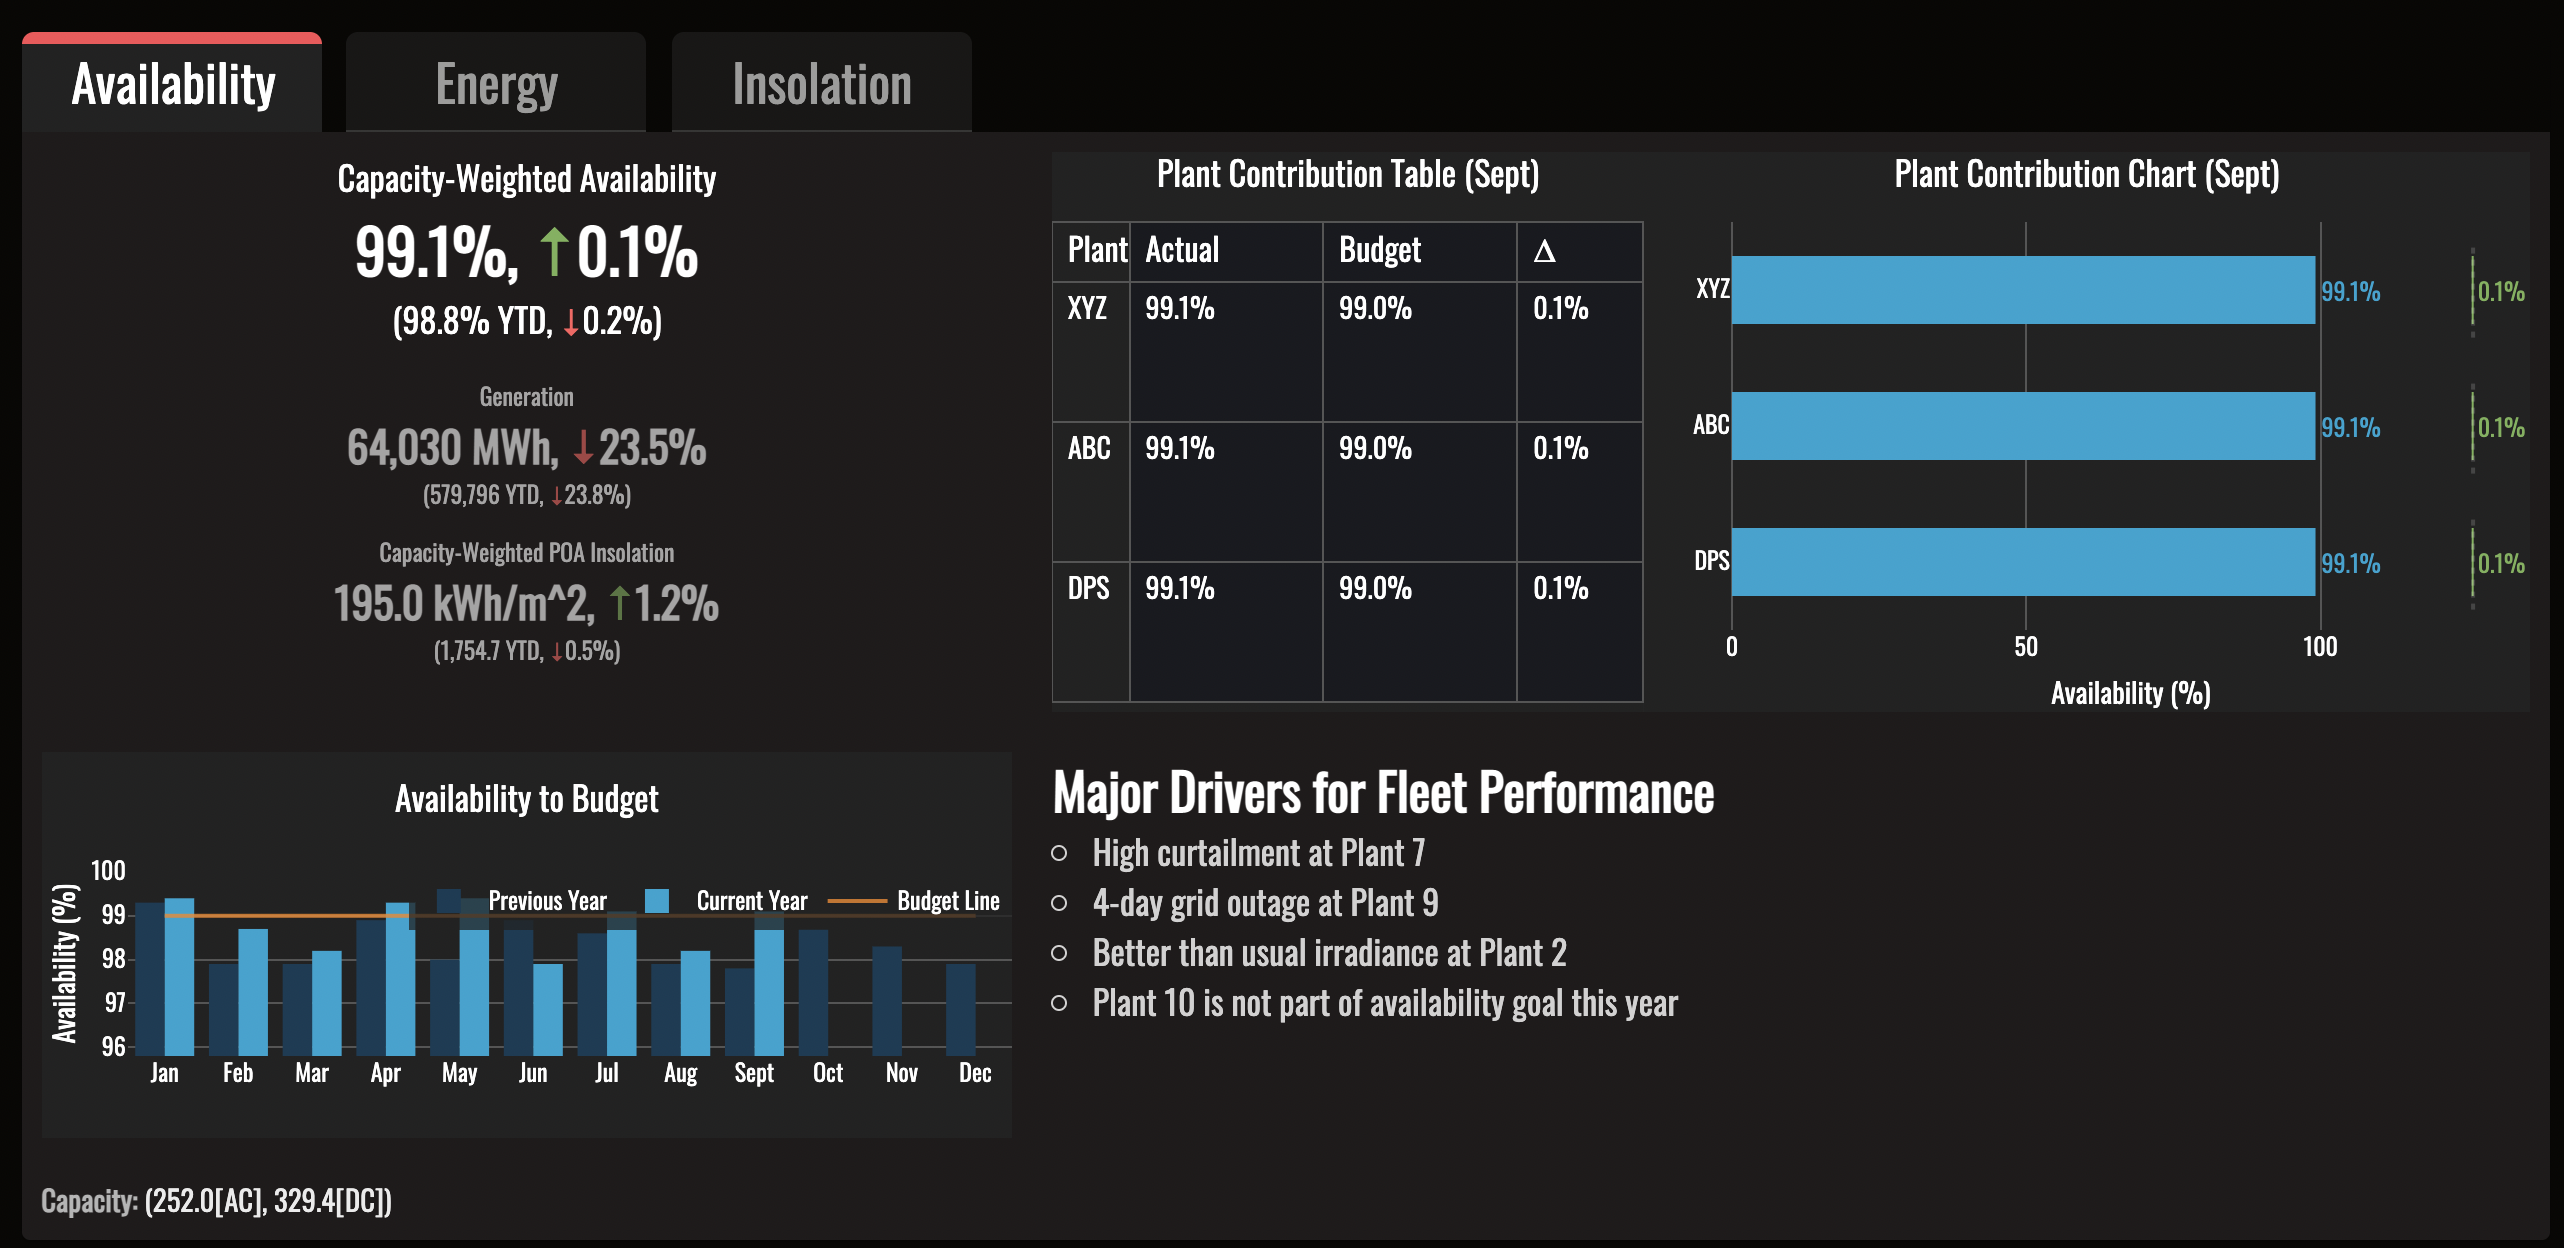
- Designed and developed a three-page dashboard to display performance and budget issues across a fleet solar components.
- The app displays KPIs such as Availability and Insolation for solar plants to allow analysts to identify the outliers and make informed decisions.
A reworked version of the C19 Interventions Dashboard made in Plotly and Dash.
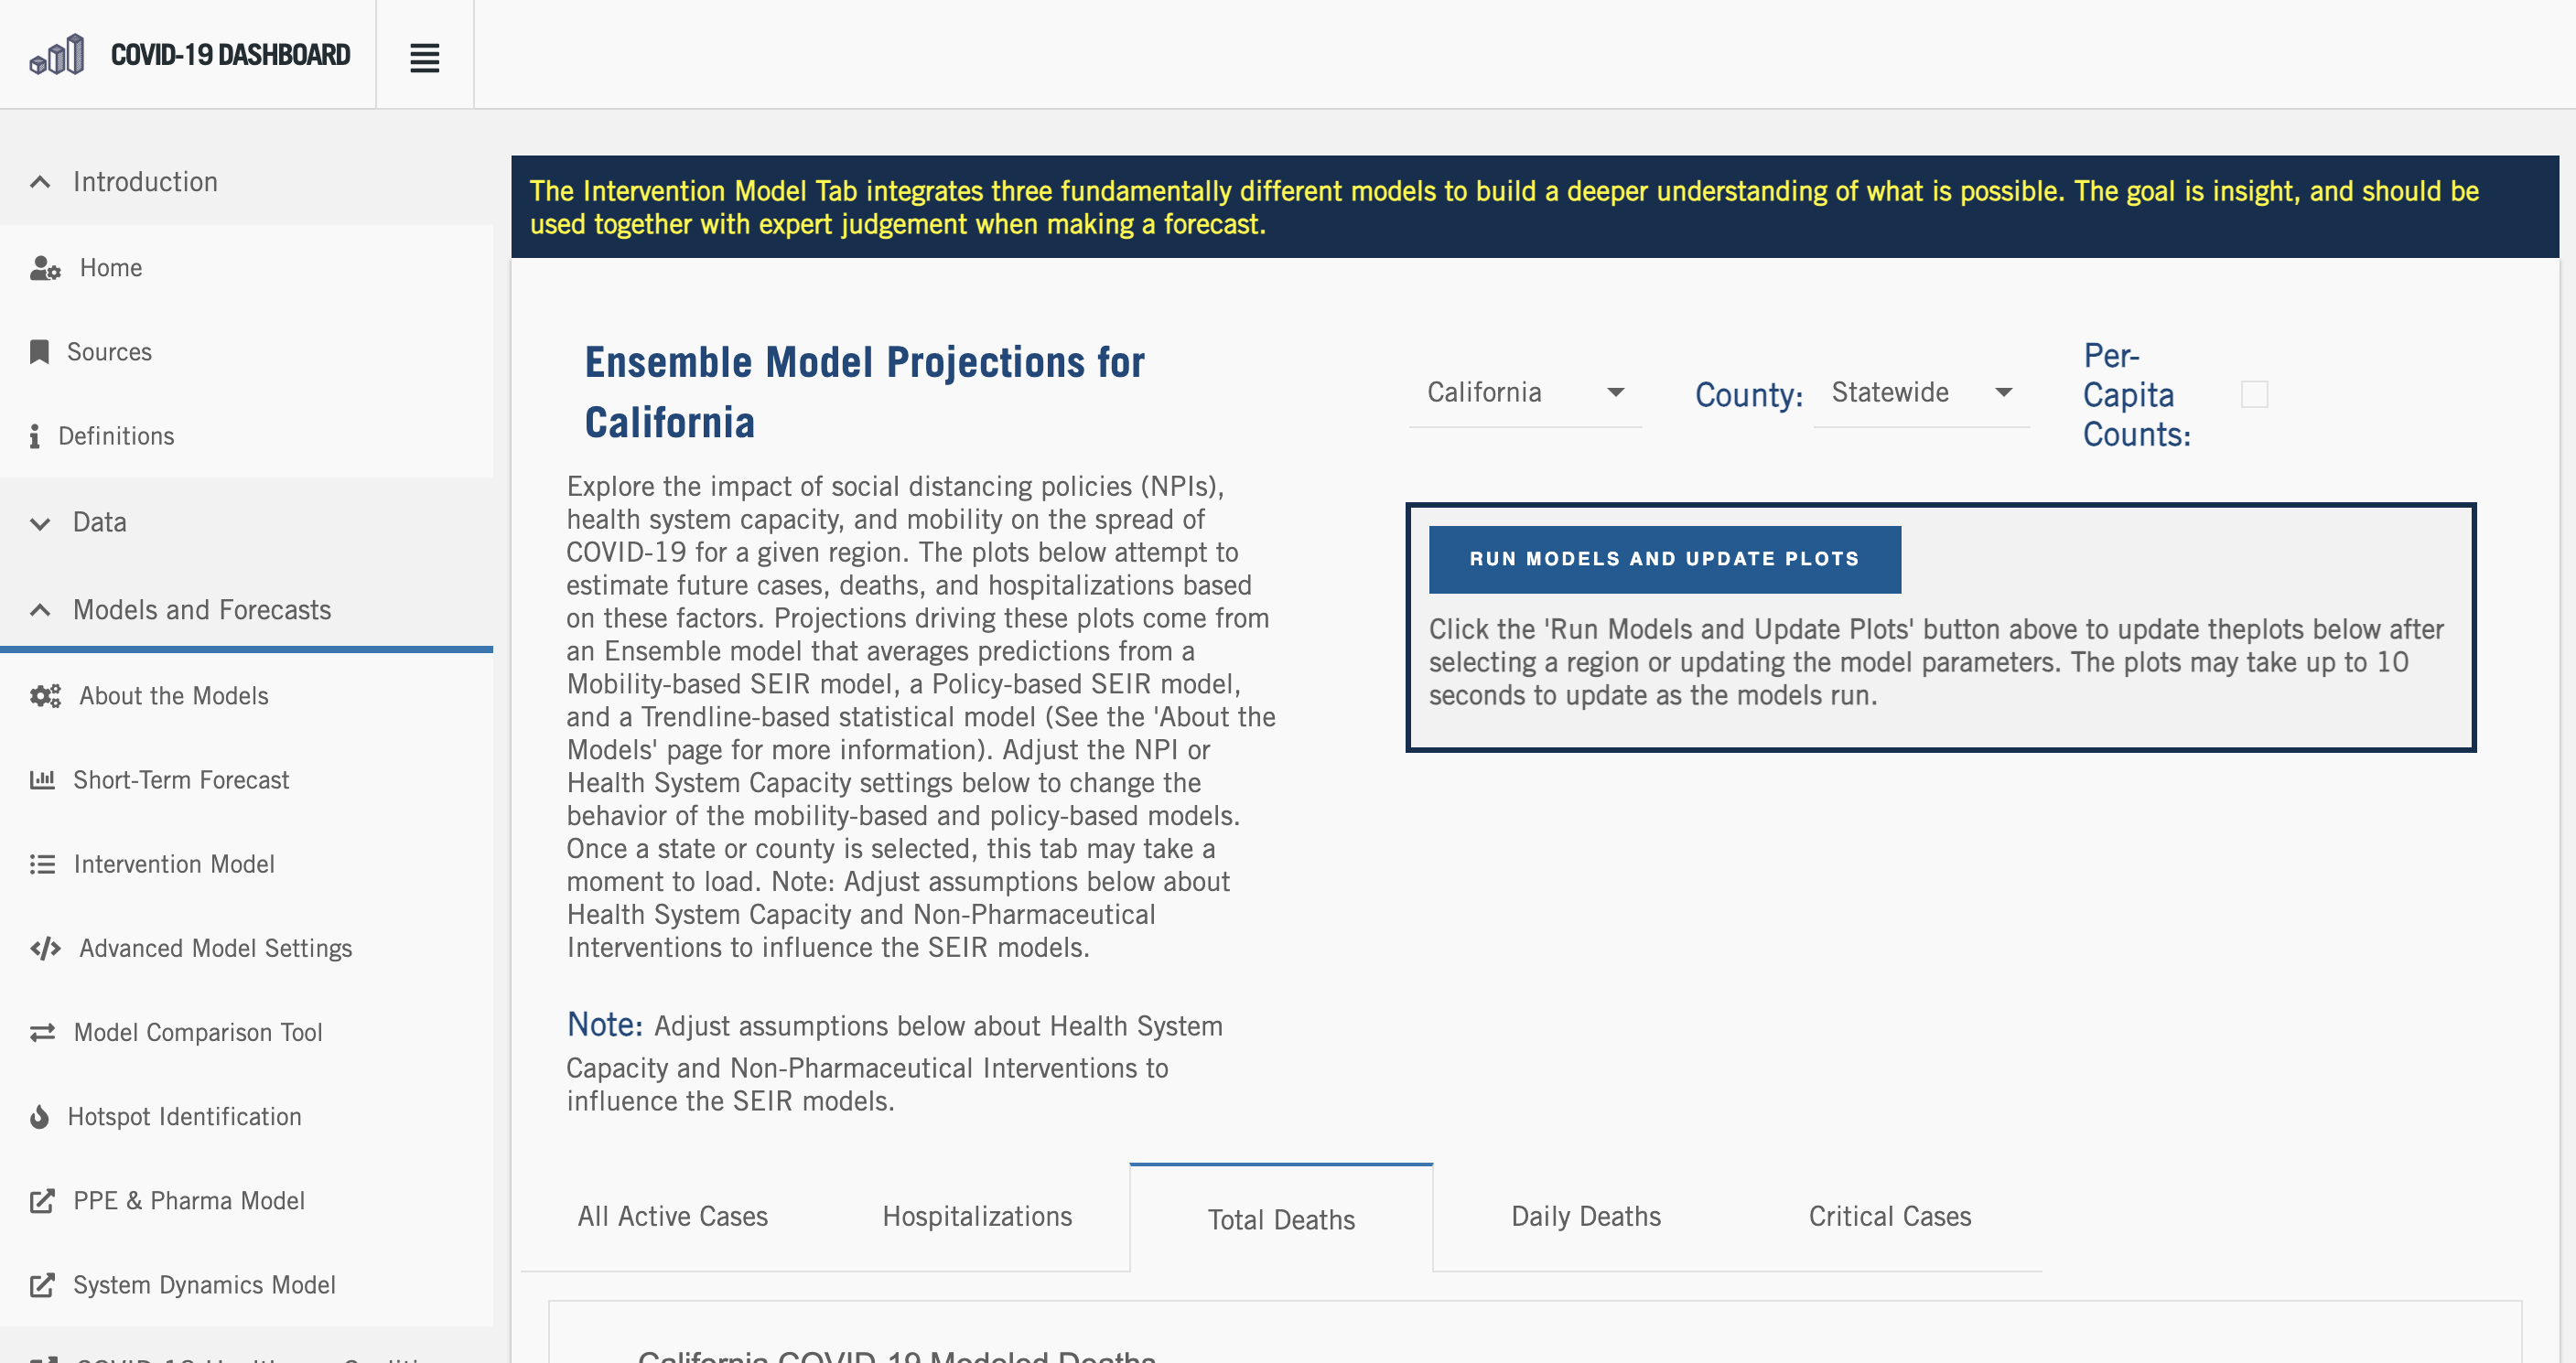
- Developed an MVP that remade an R-Shiny app from the ground up using the Dash Design Kit.
- The MVP uses mock data, with only 3 states available: California, New York, and Washington.
Projects
A Tetris-inspired arcade game I published on itch.io.
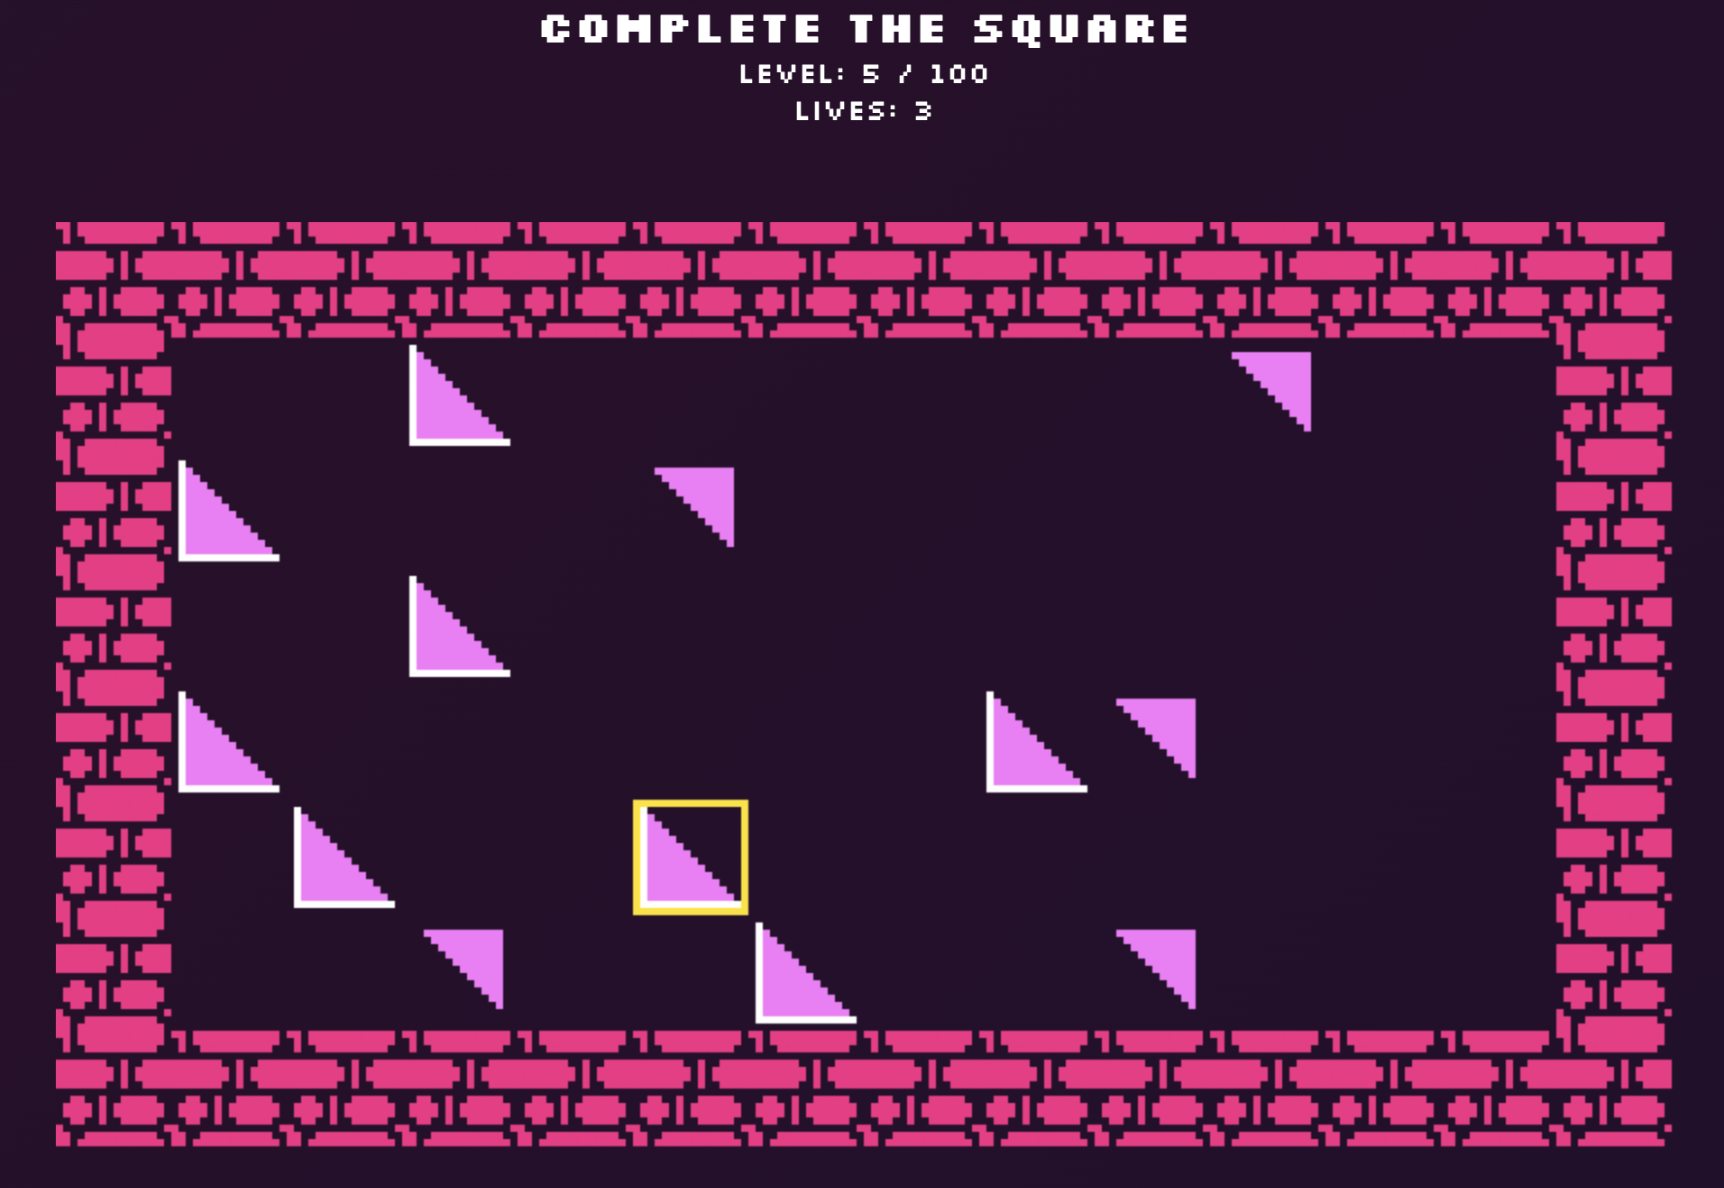
- You can watch the trailer on YouTube.
A fun exploration of what playlists could look like if they were two dimensional.
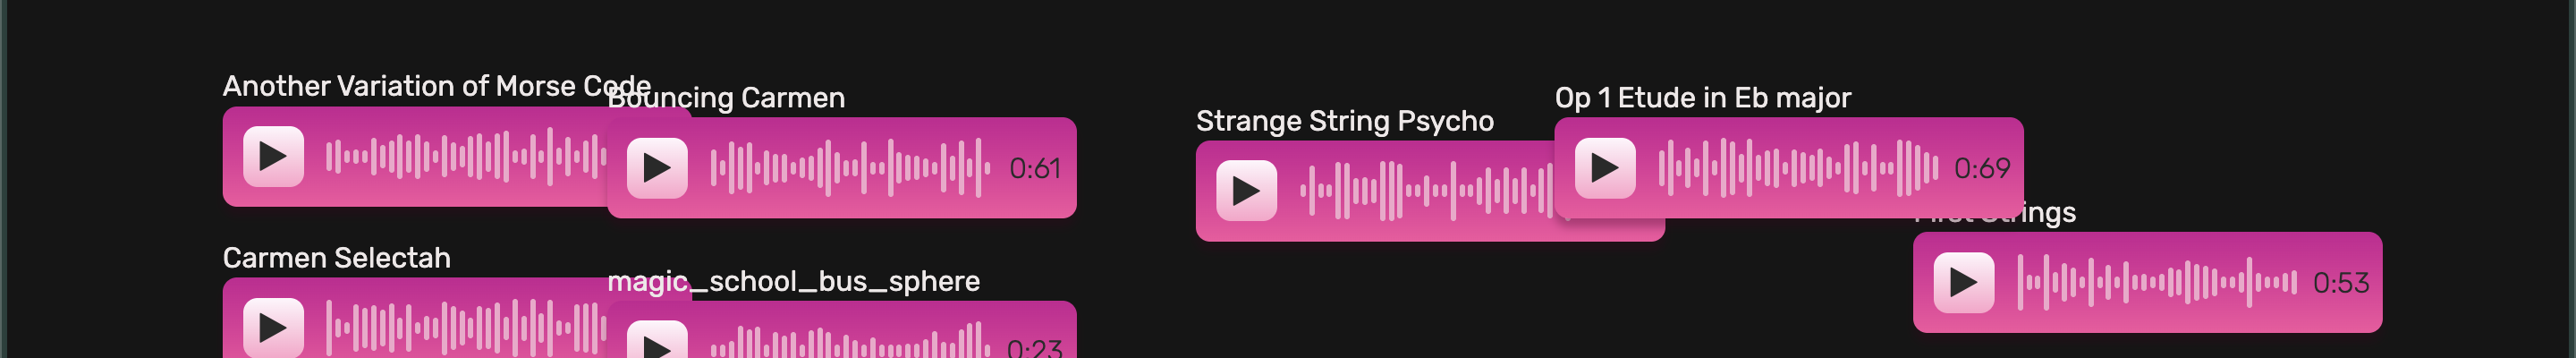
- An experiment that reimagines connections between audio by employing the 2nd dimension.
- To login, use the demo credentials that are on the login page.
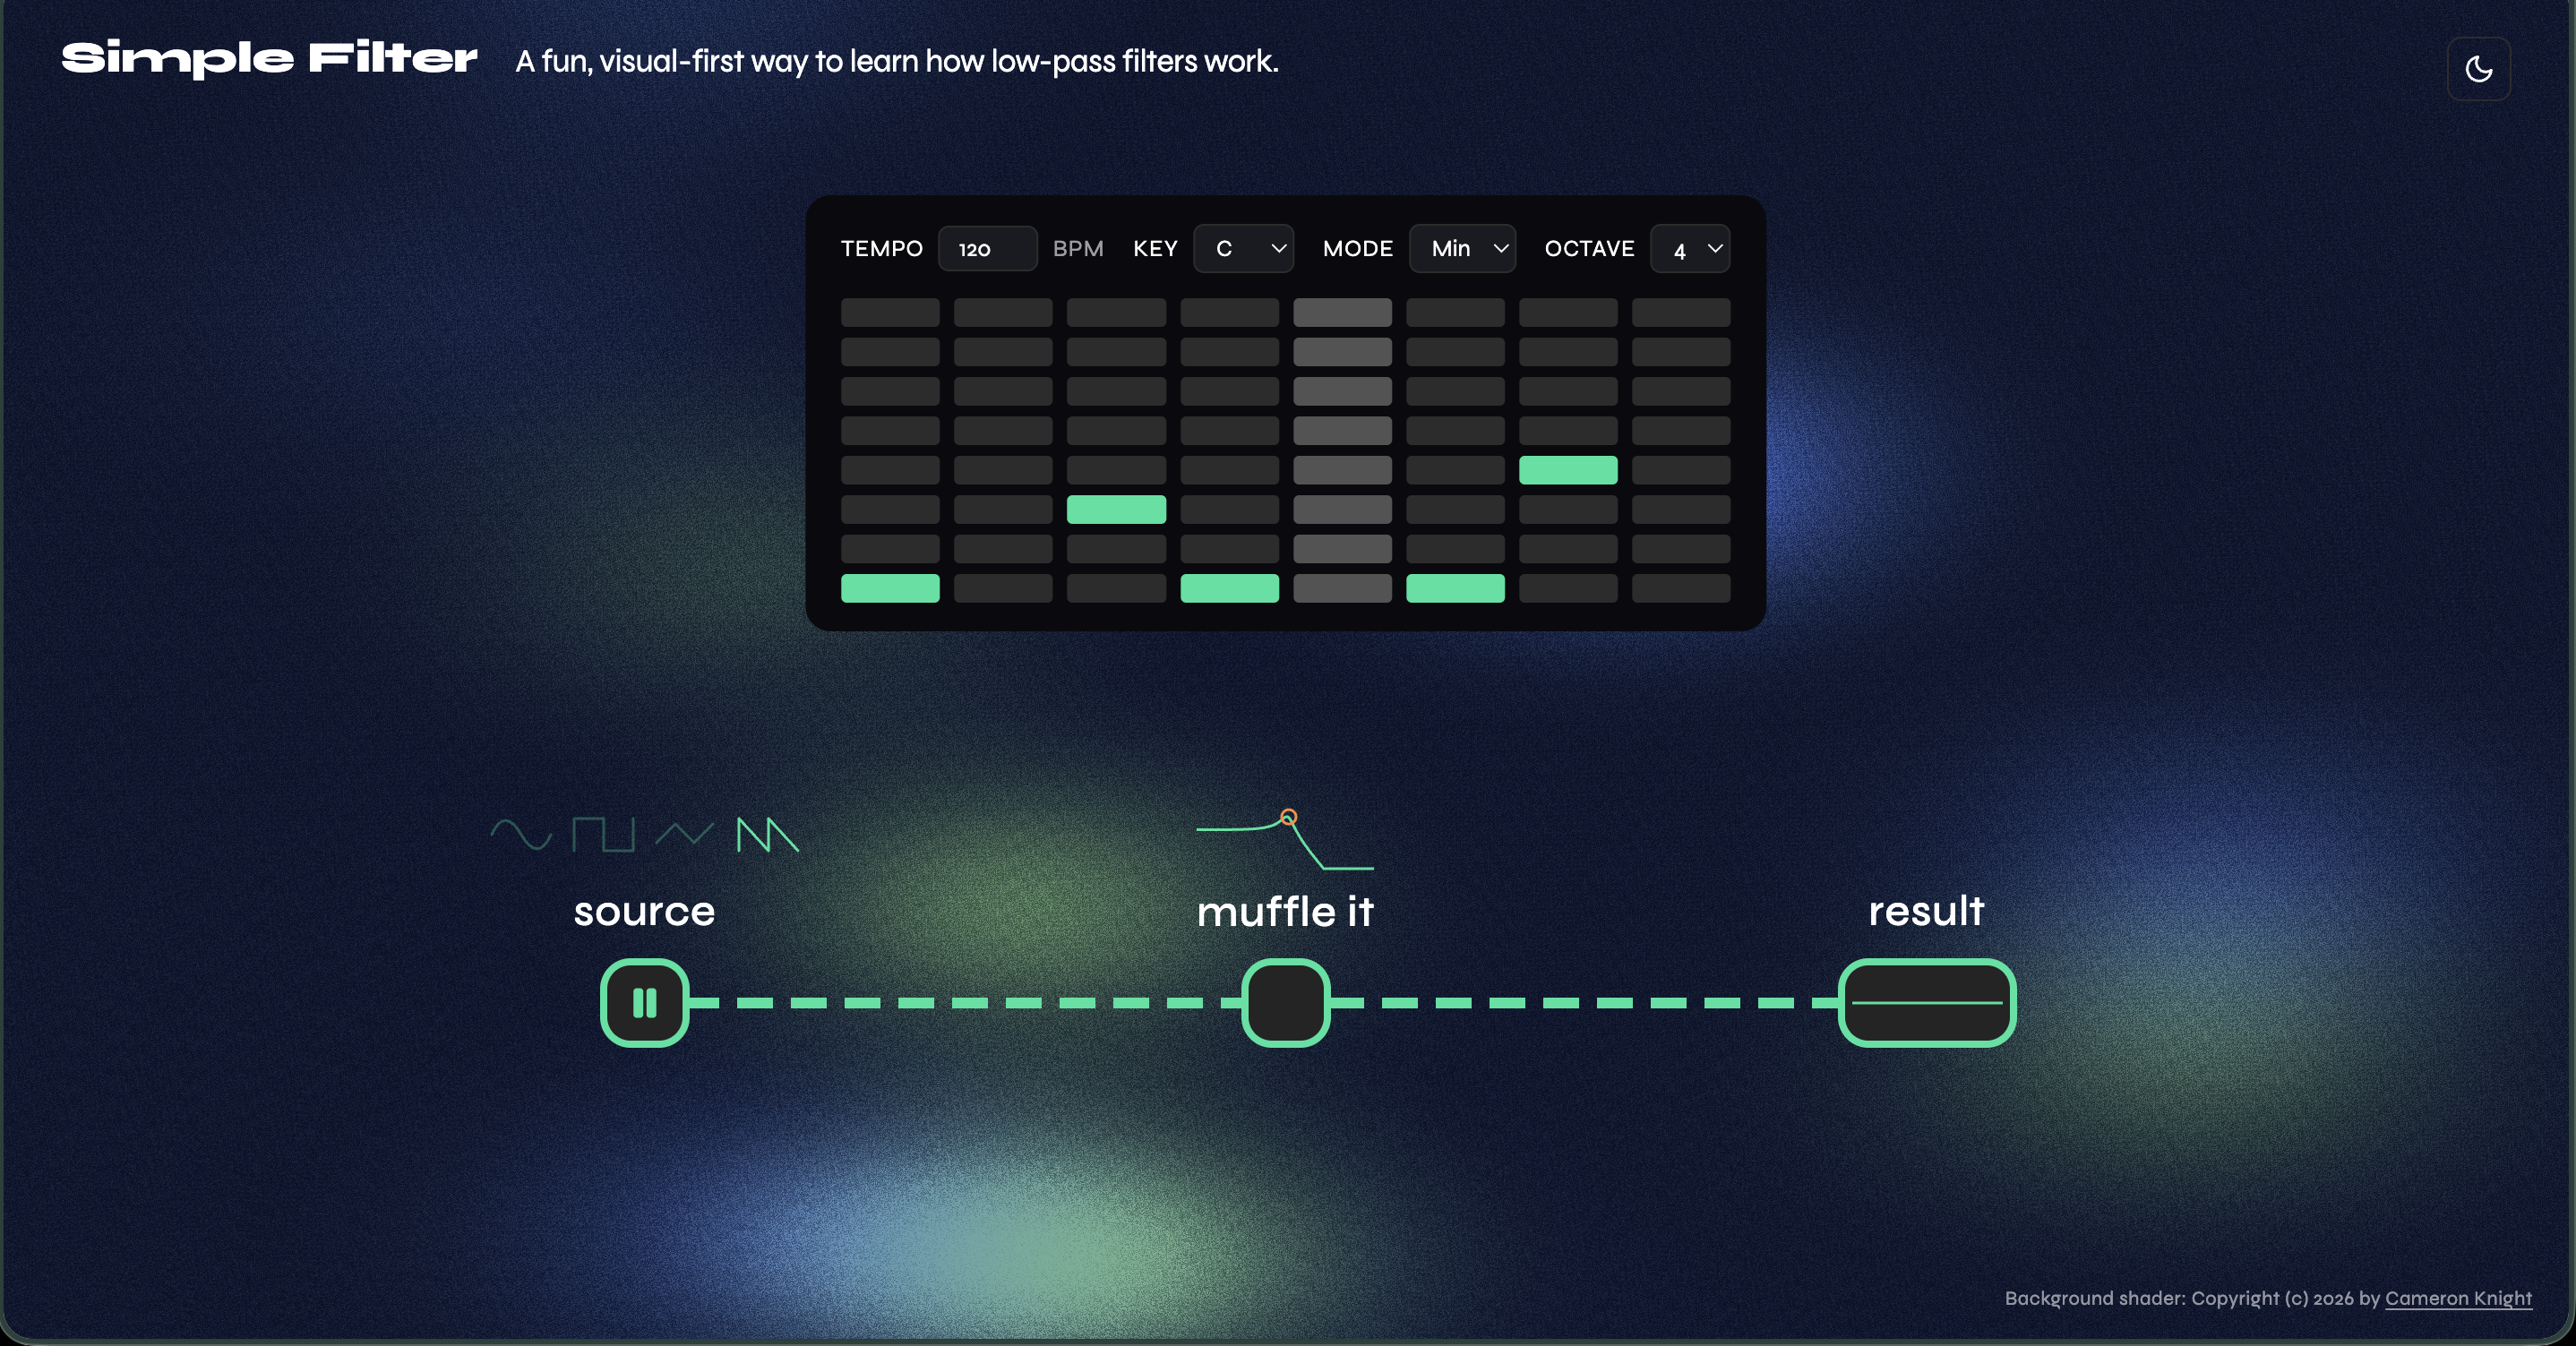
A project that aims to explain low-pass filters visually.
A co-op version of the classic wikipedia speedrun game.
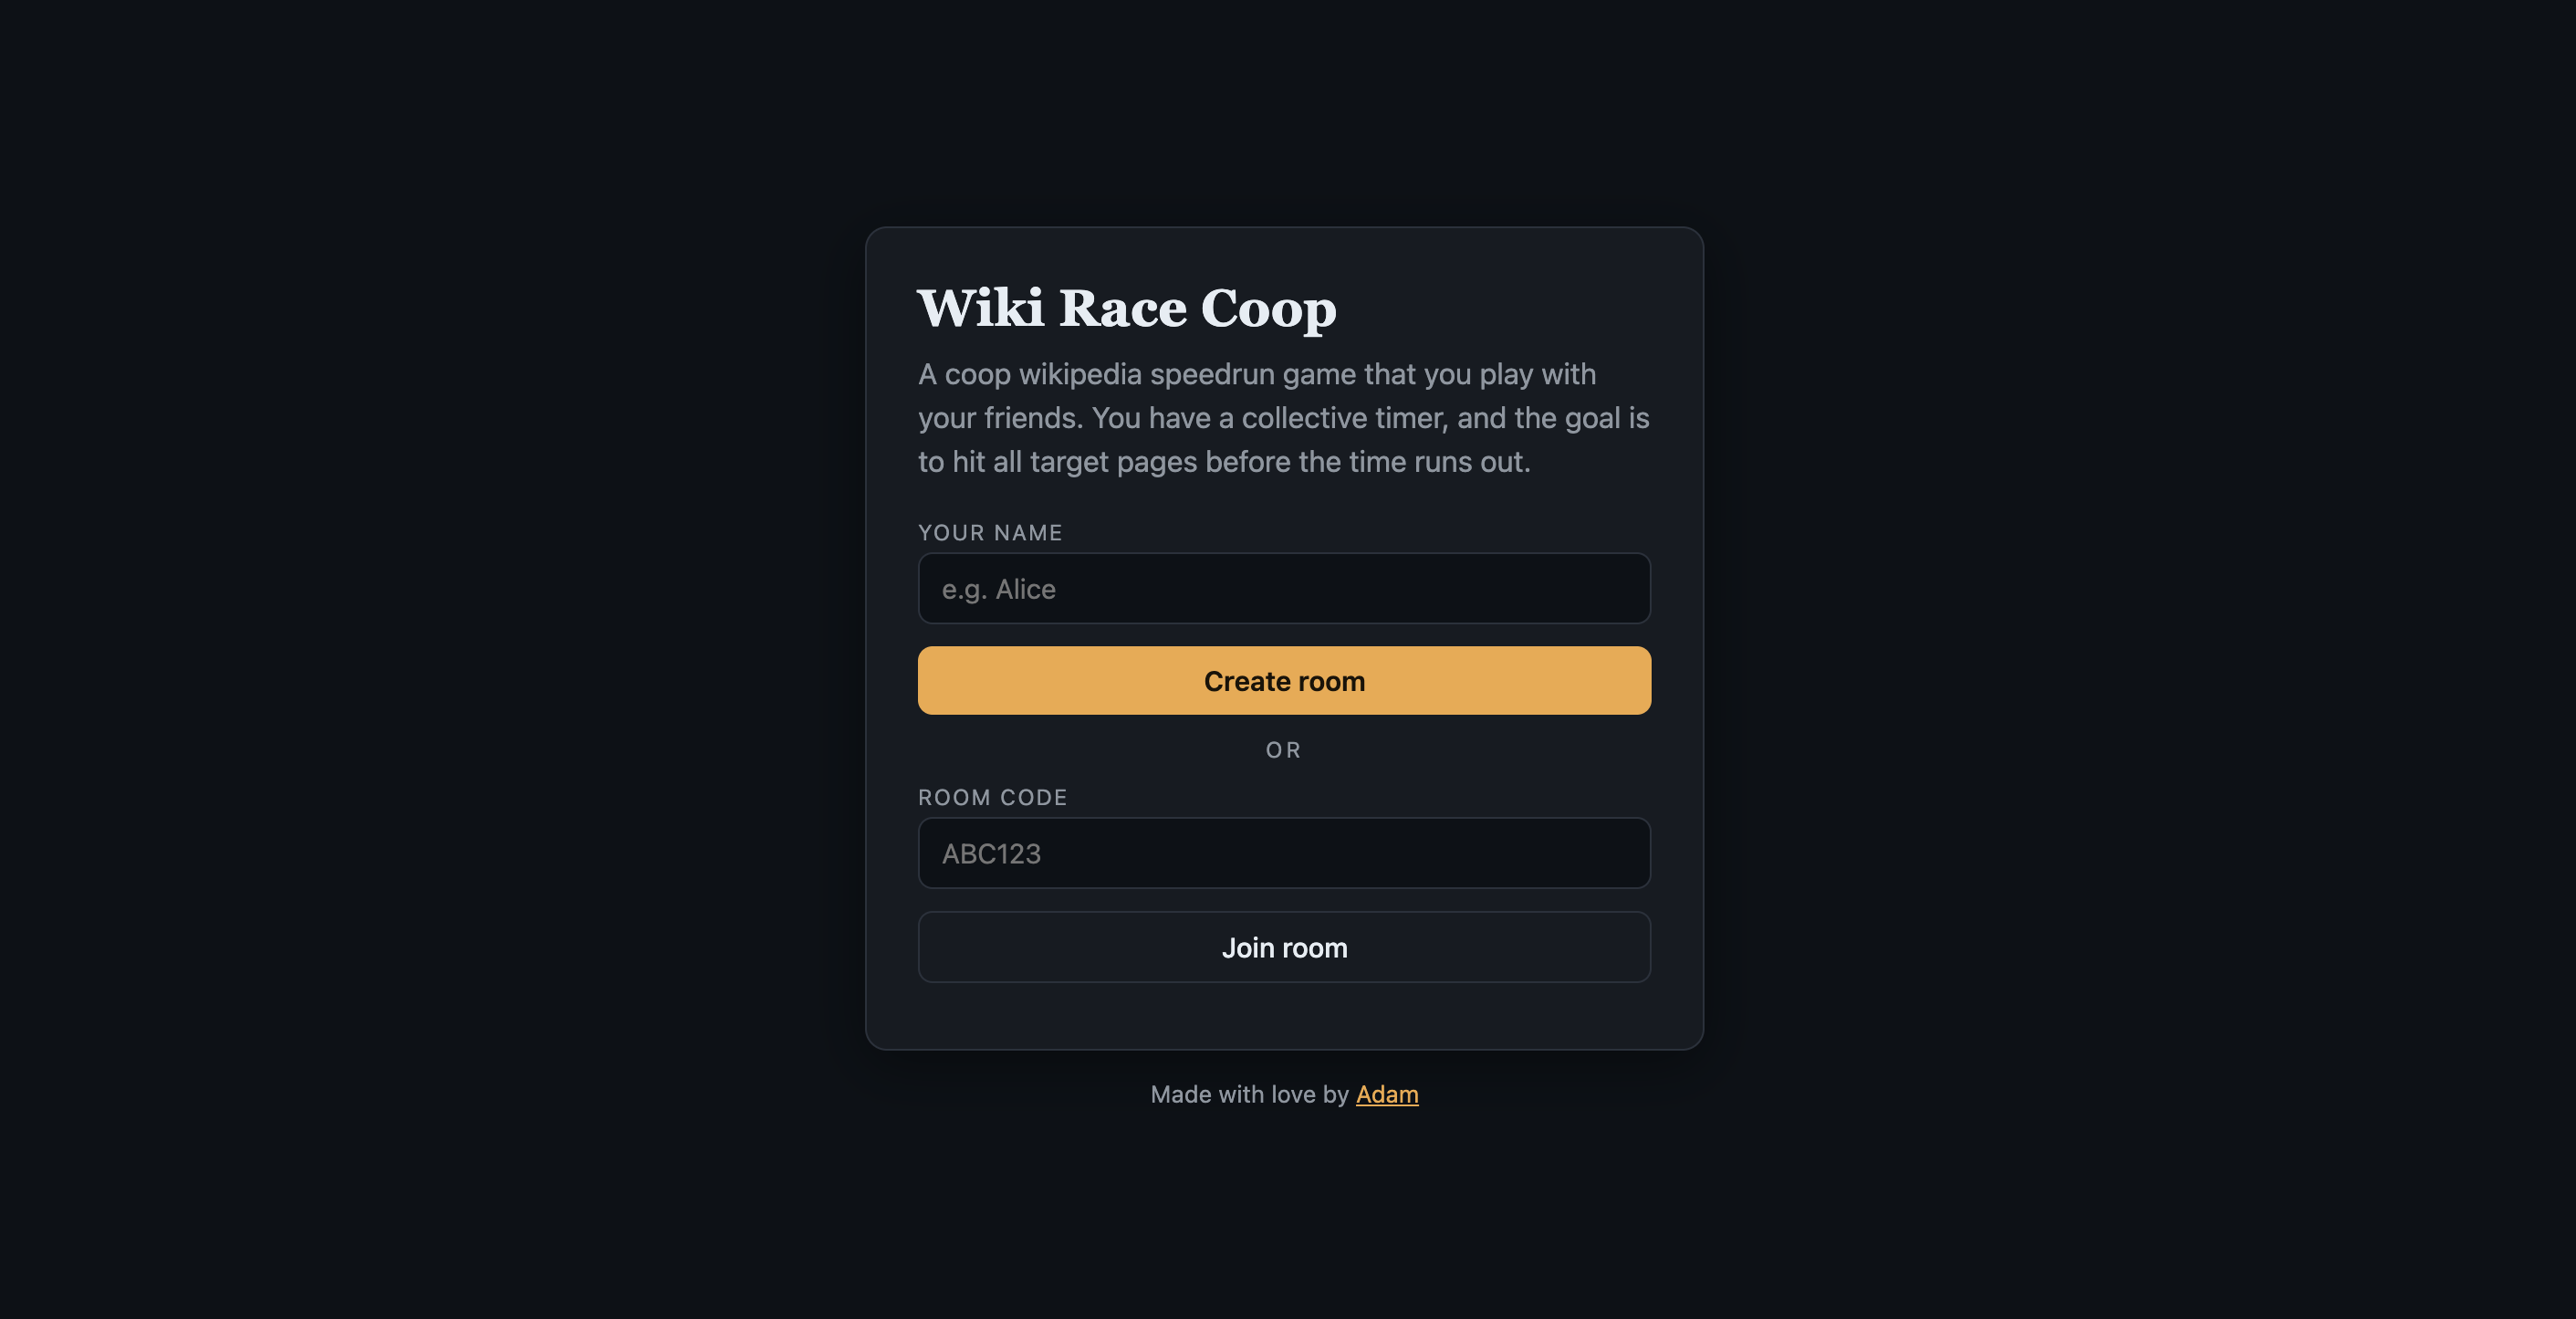
Create rooms, and play with your friends to hit all the target pages before the time runs out.
A tool for making sprites and pixel artwork.
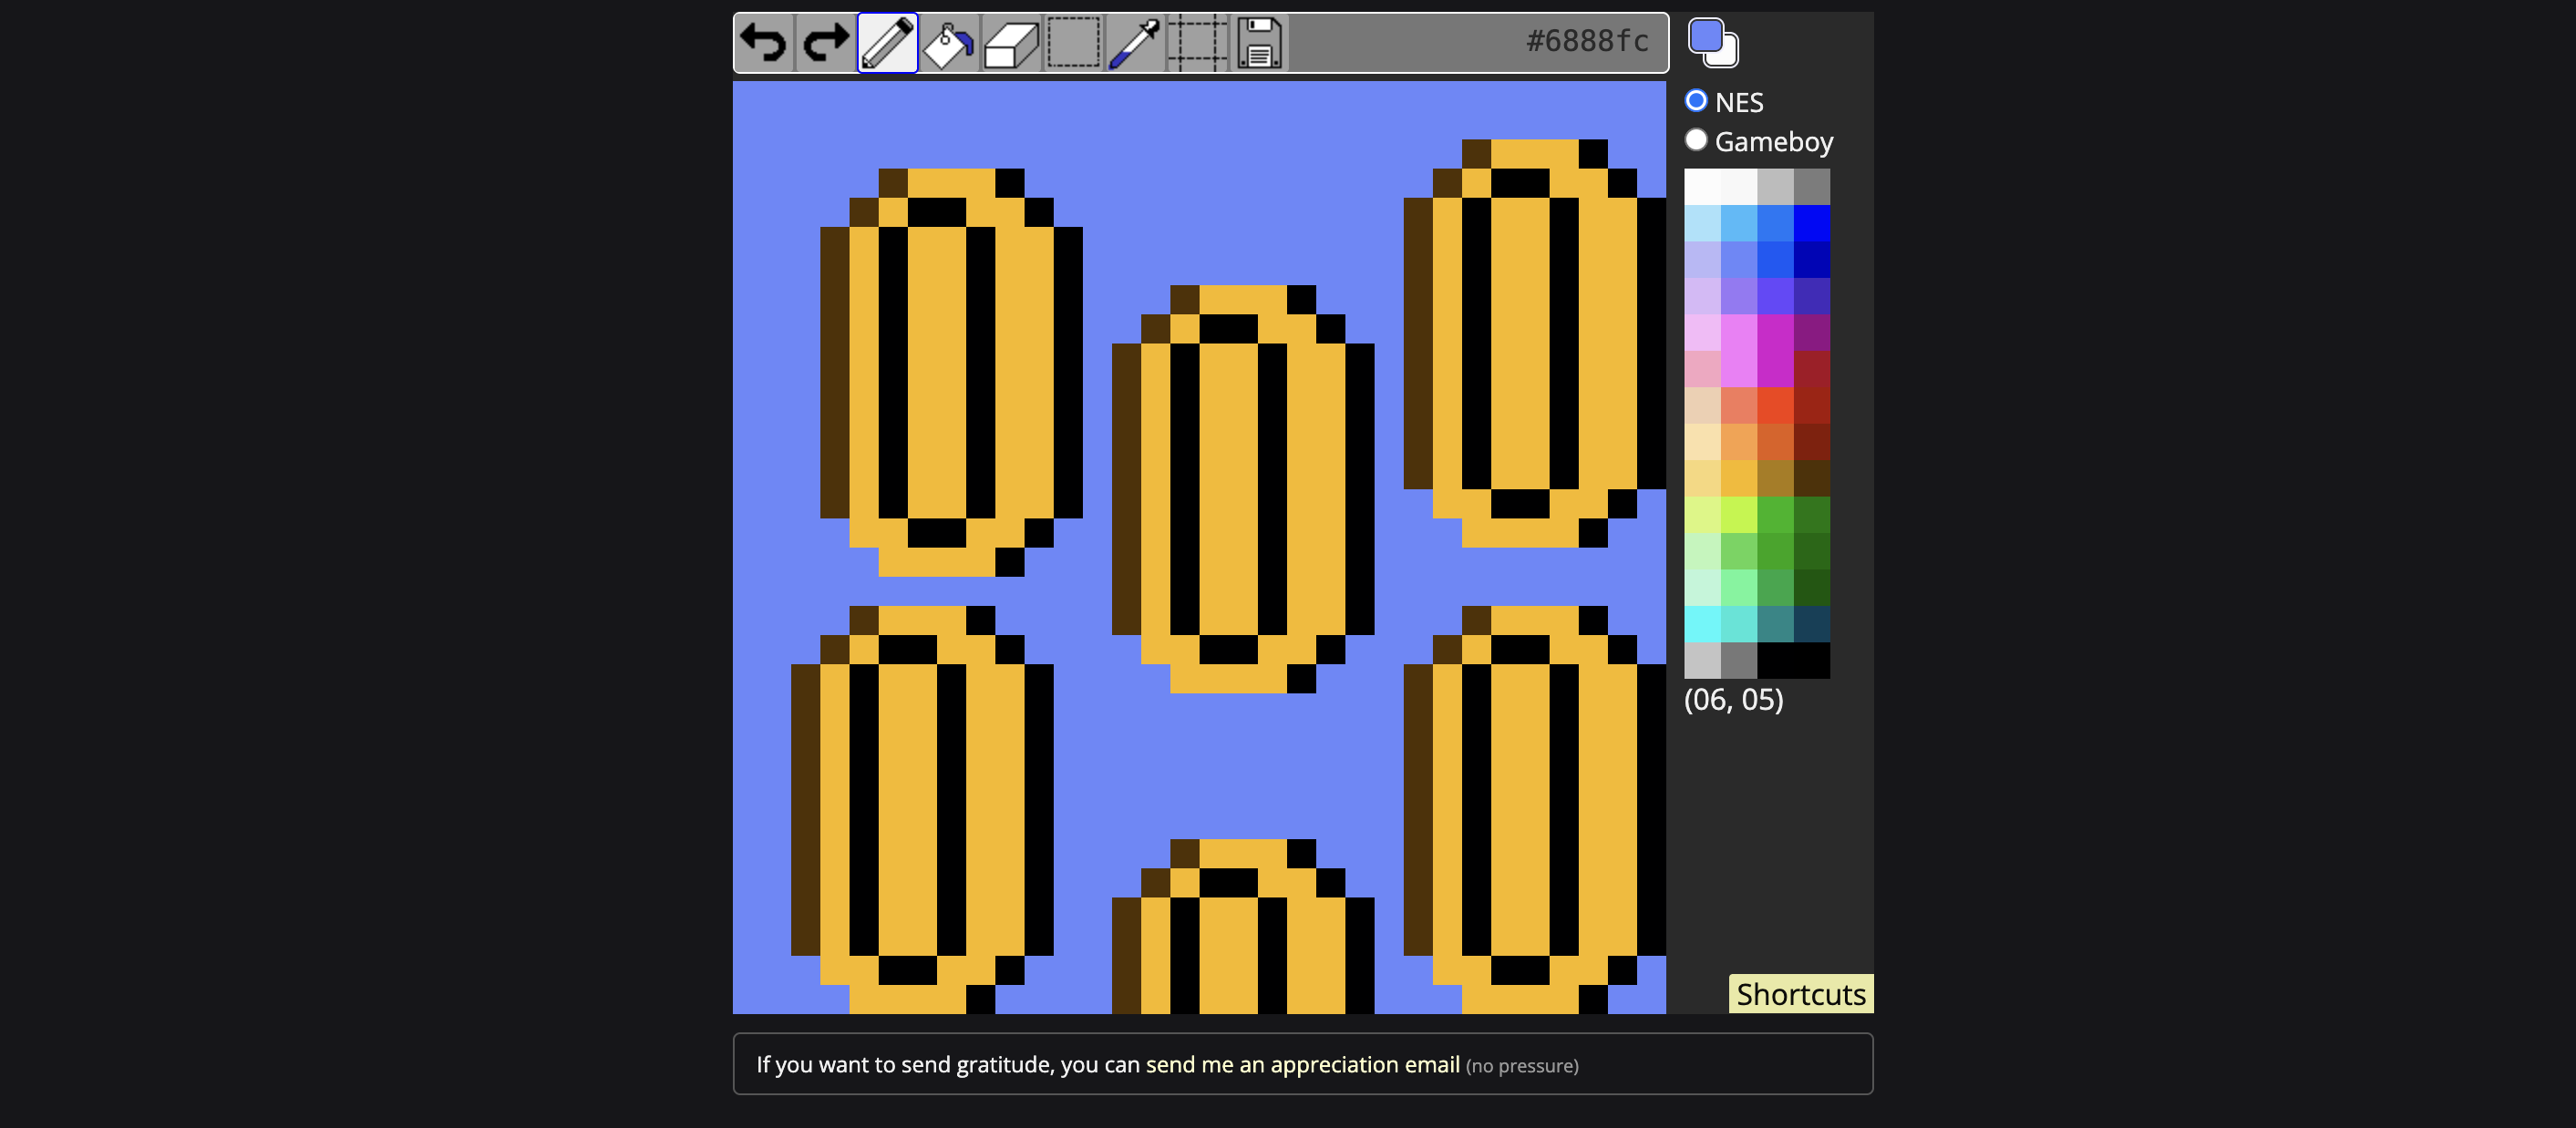
- To date, this project has 500+ stars on Github and 10+ contributors.
About Me
A brief timeline
I worked at Plotly between 2016 - 2019 where I created key charts such as Sploms and Gantt charts to help the python library hit more than 3 million downloads. To date, I’m the top #4 lifetime contributor to the Plotly Python Library.
Since 2020, I’ve been running a small boutique design shop called Zyphr, helping small to medium sized businesses visualize their data. Our industries range from TechBio, Finance, Health, and the Renewables space.
Working with the garage door open
Inspired by folks like Andy Matuschak and Alexander Obenauer, I am becoming more and more comfortable posting thoughts, incomplete work, and scrappy prototypes across various places on the internet. The more of your true self you reveal, the more easy it is for people who resonate with the real you to find you.
In this spirit, here is an ongoing collection of study ideas that I eventually want to start working on Study Design Catalog.
I also occasionally write on one of my substack publications:
Miscellany
Public Speaking
Music